Chemical analysis of non-metallic inclusions in steel
SEM-EDX
Fully Automatic Analysis of Steel Inclusions
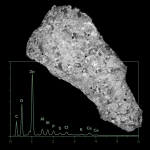
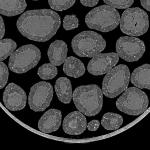
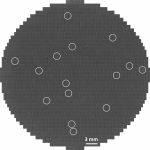
During the analysis of the steel sample, size and shape of all inclusions are measured by scanning electron microscopy (SEM). Simultaneously, an X-Ray element spectrum (EDX) is recorded for each particle, which is utilized to determine the composition of the individual inclusion. The measurement takes between 20-60 minutes, depending on the size of the sample. Only a single polished steel sample is needed to perform the analysis.
Measurement, evaluation and reporting are automated and, for the most part, run without user intervention. In addition to ternary diagrams, size histograms, shape parameters, images and individual spectra can be viewed.
Shown are typical ternary diagrams that are suitable for the evaluation of non-metallic inclusions and thus for the quality of the steel product.