


ONLINE BASIC COURSE
Cleanliness analysis according to VDA 19.1 & ISO-16232
Part 9
Presentation of Particle Cleanliness
For each particle type, the particle size distribution is typically plotted in a histogram against the maximum number of particles allowed (see figure).
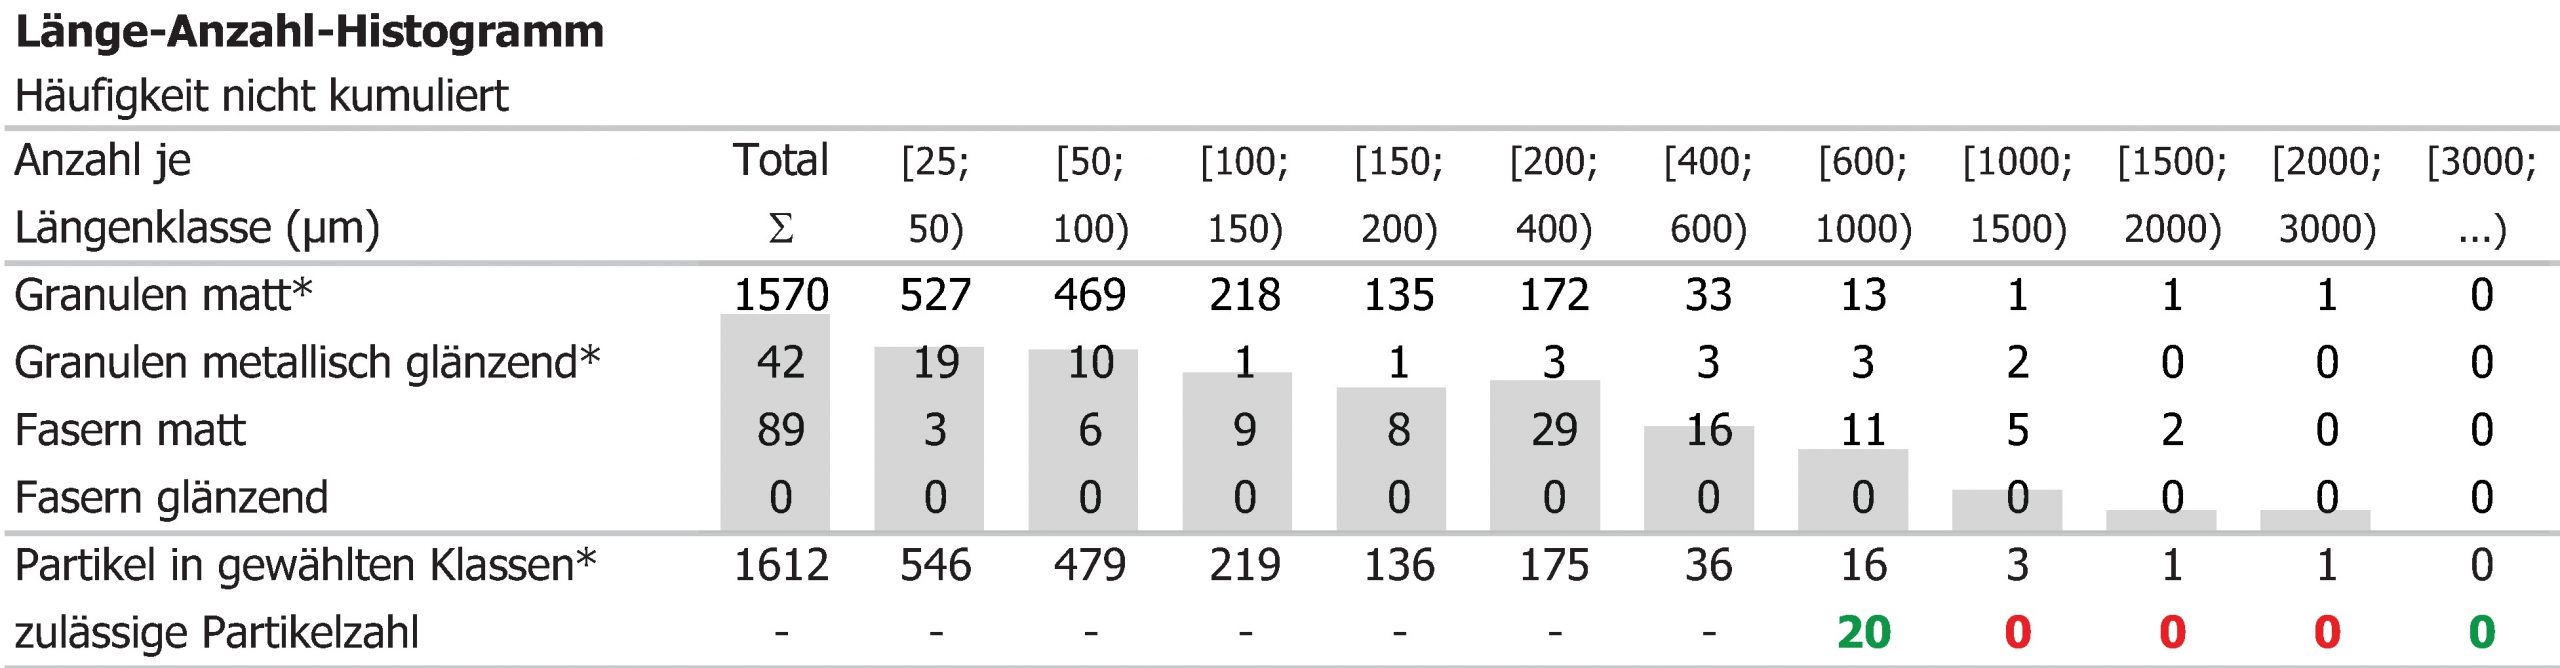
Particle size distribution plotted as a histogram in a cleanliness report
By definition, any object detected on the filter is referred to as a particle. Particles are further divided into soft fibers and solid granules. Often, the soft fibers are neglected in a cleanliness specification, since their damage potential is considered low.
The automatic distinction between fibers and granules is based on a simple shape recognition. In addition, optical instruments are capable of detecting metallic reflections of particles. It has become common to distinguish between matt and metallic glossy particles. This typification allows a more accurate assessment of damage potential.
Nevertheless, it is to be emphasized that the identification of metals by means of light-optical methods represents more of an "estimate", rather than a reliable material analysis. Especially if particles have a corroded surface, which is often the case, metallic reflections cannot be seen. On the other side, metallic pseudo reflections can be caused by glossy plastic or glass particles. If a particle's material and thus its origin is to be reliably identified, other methods such as SEM-EDX or Molecular Spectroscopy have proven to be flawless.