Fully automatic SEM-EDX analysis of residual dirt particles according to material & hardness
SEM-EDX Fully Automatic
Operating Principle
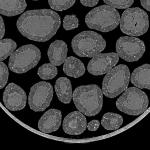
This method automatically analyzes particle size and composition in a single step. Even the smallest particles (<1 μm) can be measured with a high precision due to the fine rastering with the electron beam. Knowledge about a particle's composition subsequently enables a reliable determination of its origin, which can then be targeted and eliminated.
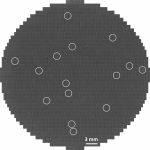
The video above shows a particle analysis in action, as run on the Aspex Explorer. The microscopic image of the membrane is displayed to the left, and further subdivided into square fields. Particles detected in the yellow field are displayed in green to the right.
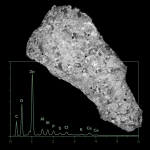
For each particle detected, an EDX spectrum is recorded and displayed at the bottom of the screen. The spectrum contains the particle's composition, which is compared with our database in order to derive its material class. Due to the high count rate of the detector, measurement time per particle is as short as 0.2 seconds. This guarantees fast analyses of large particle ensembles.
particle analysis according to material and hardness classes
Aside from constraining the origin of residual contaminant particles, the determination of the particle hardness is the most important application of the SEM-EDX method. The harder the particle, the greater the damage potential. Even though the determination of particle hardness by SEM-EDX only works indirectly, a hardness class can be accessed by precisely assigning particles into different material classes.
The molecule spectroscopy is predestined for the identification of organic particles and filmic contaminants.
Furthermore, SEM-EDX has proven to be effective in analyzing organic contaminants, due to its ability to inspect large particle numbers in an automated manner. The particles are prepared onto a metal membrane in order to increase the contrast. Organic material groups can be identified accurately by analyzing the particles in a ternary diagram.
The following example shows the analysis of an organic contaminant. PU and PA plastics are the dominant particle assemblages, as can be demonstrated using the ternary C-O-N (carbon, oxygen, nitrogen) diagram.